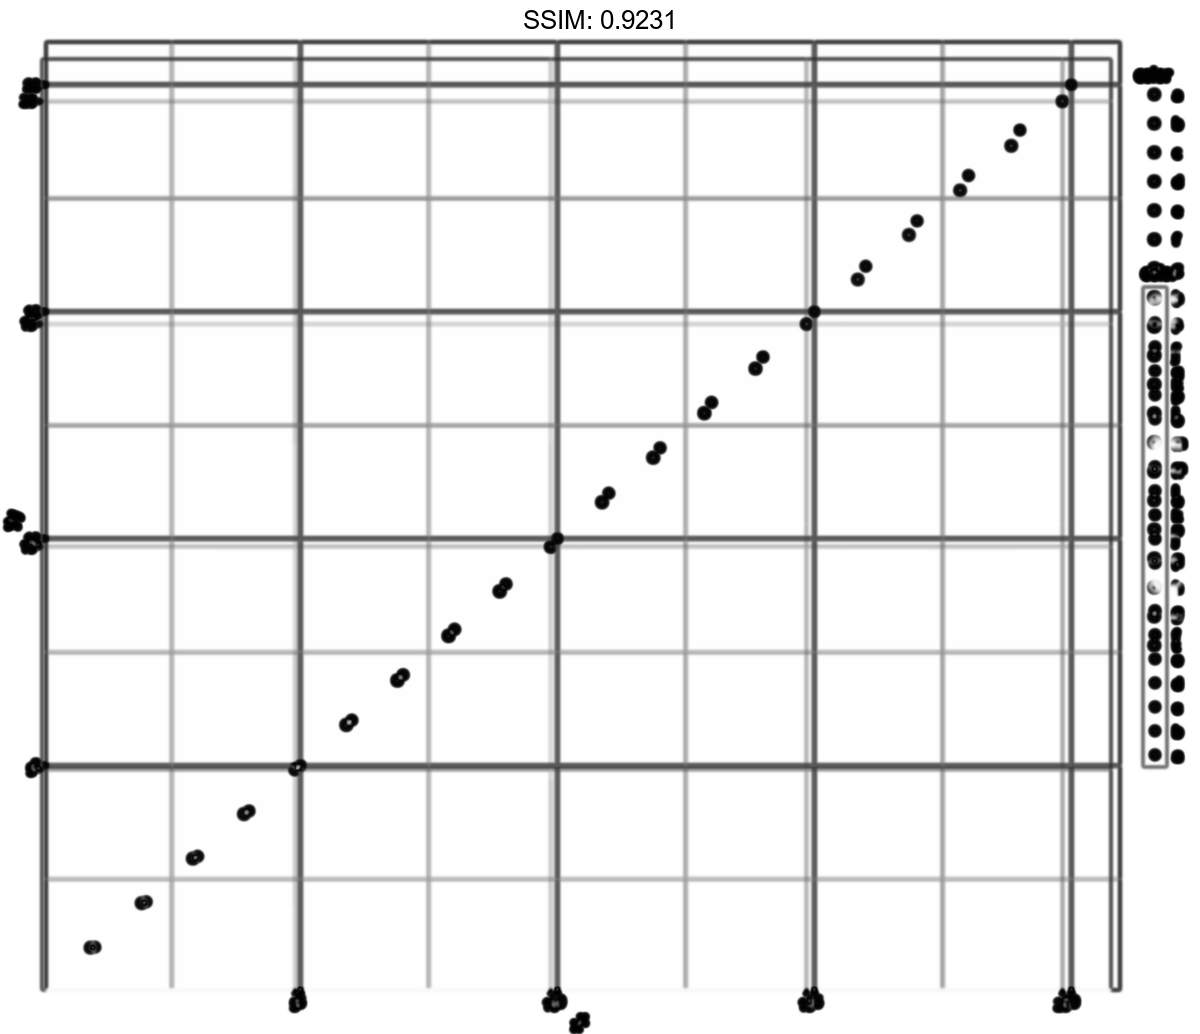
GGPLOT - guide_legend
Shows legend type guide to show key mapped onto values and then convert them with ggplotly.
df <- expand.grid(X1 = 1:10, X2 = 1:10)
df$value <- df$X1 * df$X2
p1 <- ggplot(df, aes(X1, X2)) + geom_tile(aes(fill = value))
p2 <- p1 + geom_point(aes(size = value))
p <-  p1 + scale_fill_continuous(guide = guide_legend())
plotly::ggplotly(p)


df <- expand.grid(X1 = 1:10, X2 = 1:10)
df$value <- df$X1 * df$X2
p1 <- ggplot(df, aes(X1, X2)) + geom_tile(aes(fill = value))
p2 <- p1 + geom_point(aes(size = value))
p <-  p1 + guides(fill = guide_legend(title = "LEFT", title.position = "left"))
plotly::ggplotly(p)


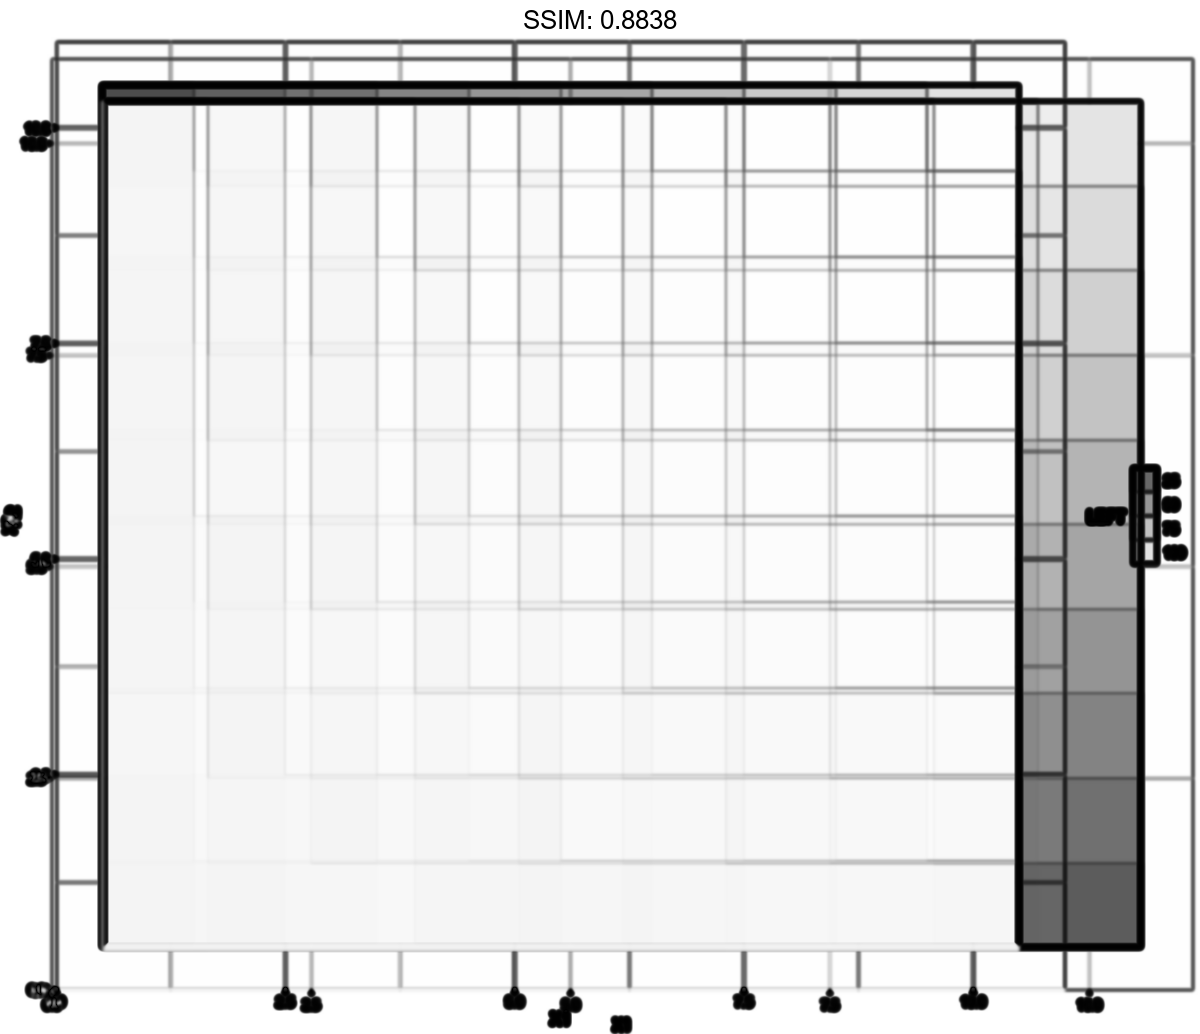
df <- expand.grid(X1 = 1:10, X2 = 1:10)
df$value <- df$X1 * df$X2
p1 <- ggplot(df, aes(X1, X2)) + geom_tile(aes(fill = value))
p2 <- p1 + geom_point(aes(size = value))
p <-
 p1 + guides(fill =
  guide_legend(
    title.theme = element_text(
      size = 15,
      face = "italic",
      colour = "red",
      angle = 0
    )
  )
)
plotly::ggplotly(p)


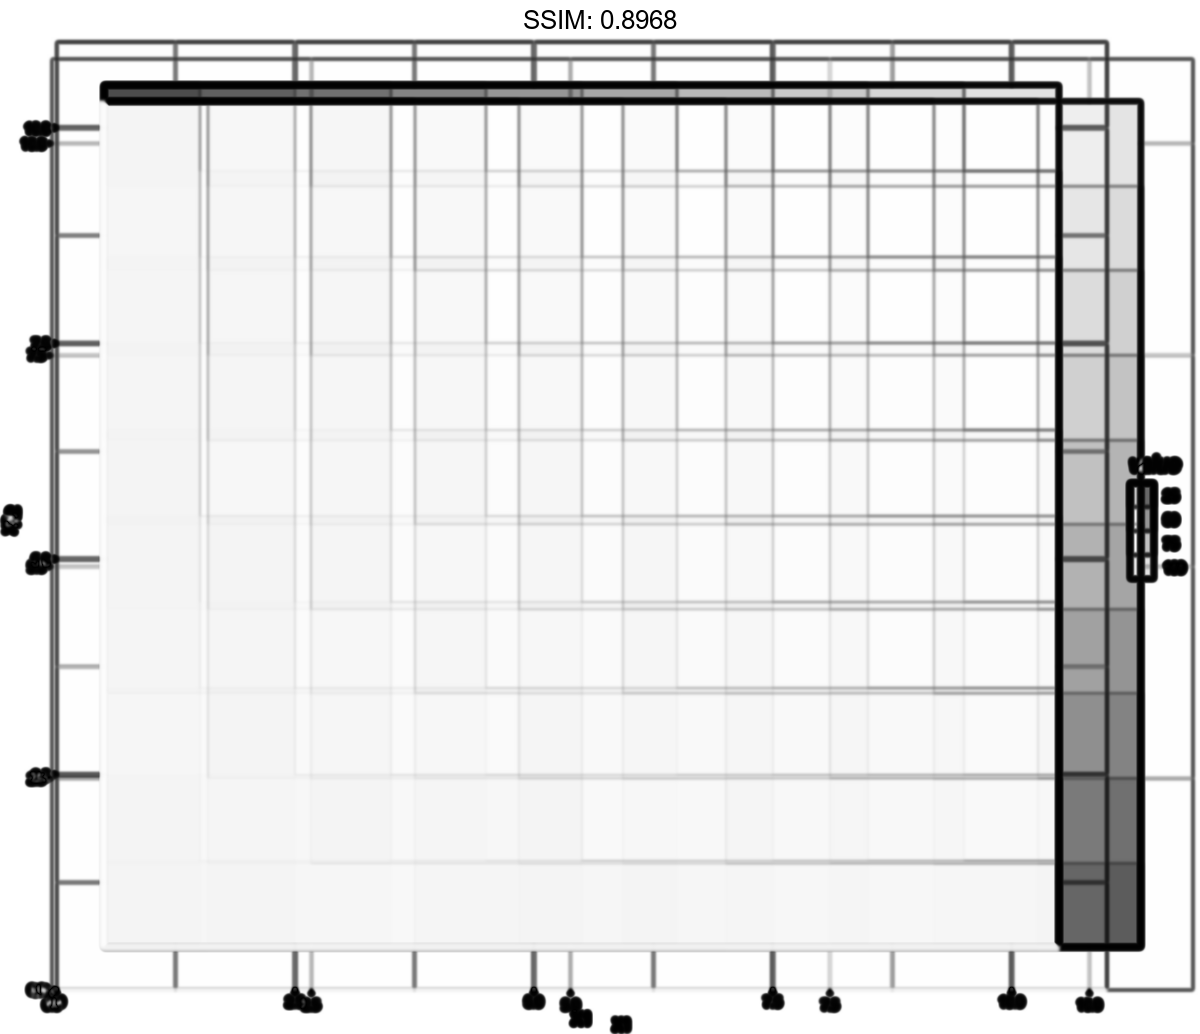
df <- expand.grid(X1 = 1:10, X2 = 1:10)
df$value <- df$X1 * df$X2
p1 <- ggplot(df, aes(X1, X2)) + geom_tile(aes(fill = value))
p2 <- p1 + geom_point(aes(size = value))
p <-  p1 + guides(fill = guide_legend(label.position = "left", label.hjust = 1))
plotly::ggplotly(p)


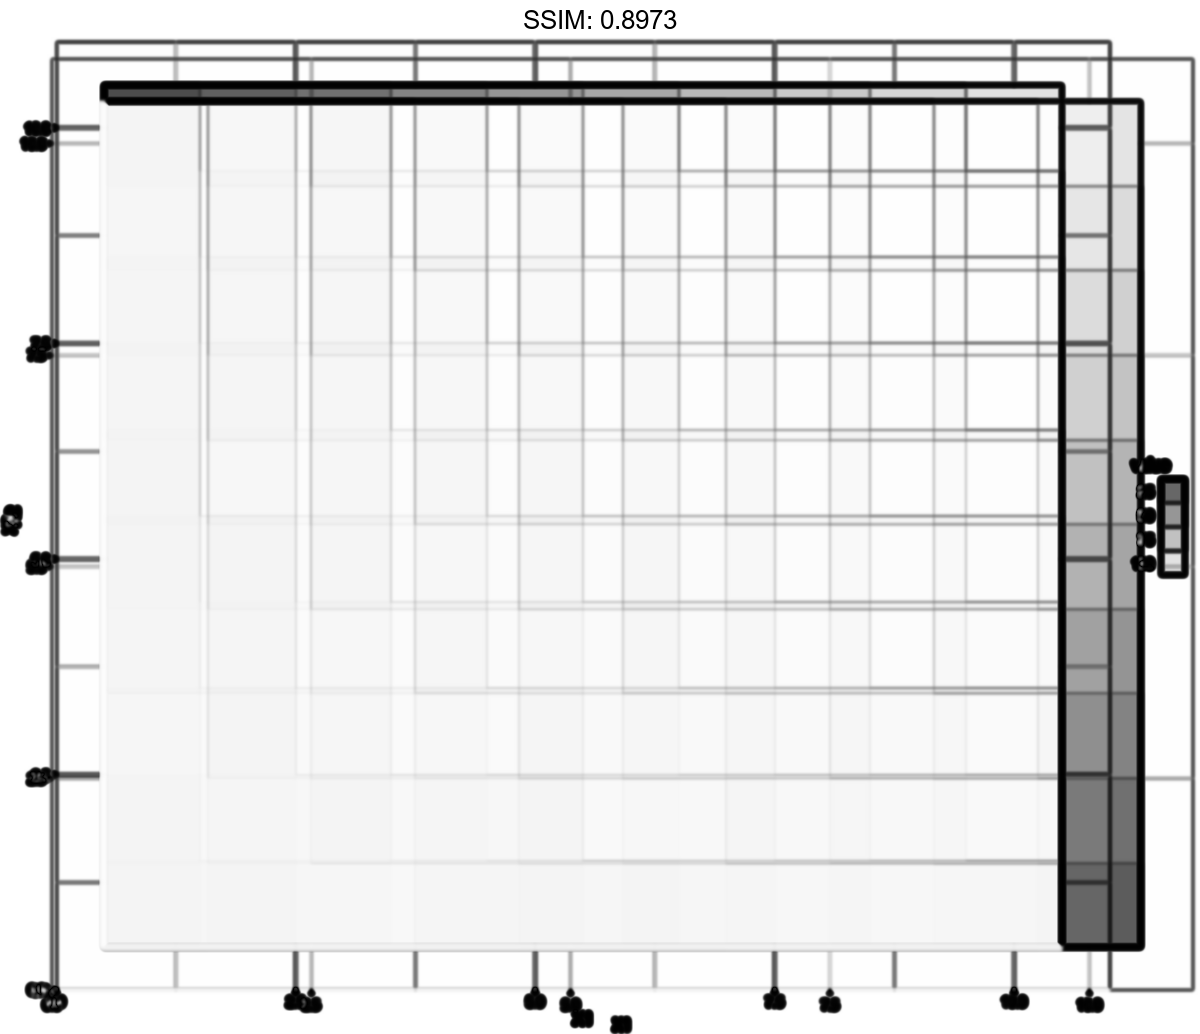
df <- expand.grid(X1 = 1:10, X2 = 1:10)
df$value <- df$X1 * df$X2
p1 <- ggplot(df, aes(X1, X2)) + geom_tile(aes(fill = value))
p2 <- p1 + geom_point(aes(size = value))
p <-
 p1 +
  scale_fill_continuous(
    breaks = c(5, 10, 15),
    labels = paste("long", c(5, 10, 15)),
    guide = guide_legend(
      direction = "horizontal",
      title.position = "top",
      label.position = "bottom",
      label.hjust = 0.5,
      label.vjust = 1,
      label.theme = element_text(angle = 90)
    )
  )
plotly::ggplotly(p)


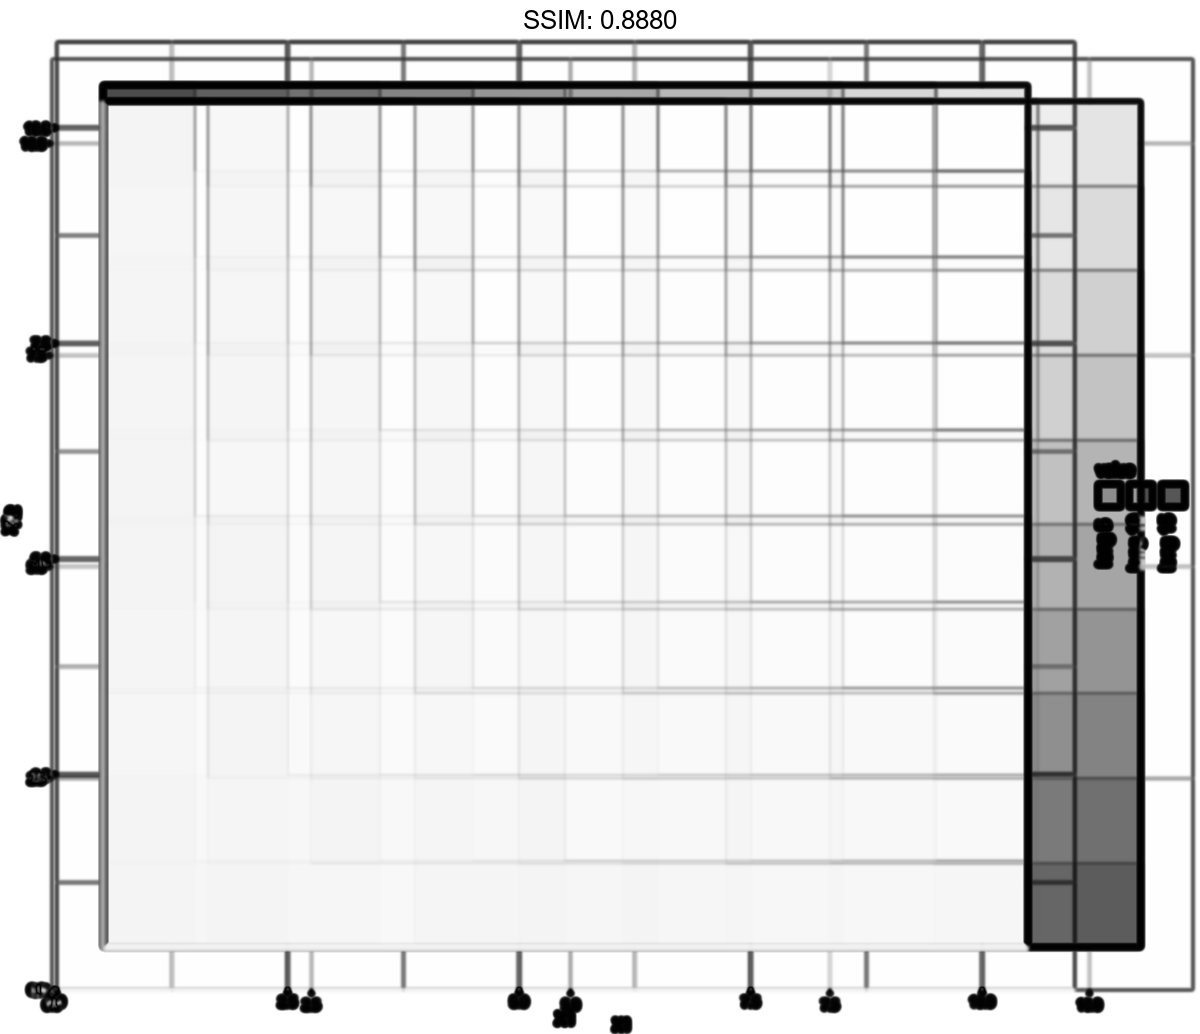
p3 <- ggplot(mtcars, aes(vs, am, colour = factor(cyl))) +
  geom_jitter(alpha = 1/5, width = 0.01, height = 0.01)
plotly::ggplotly(p3)


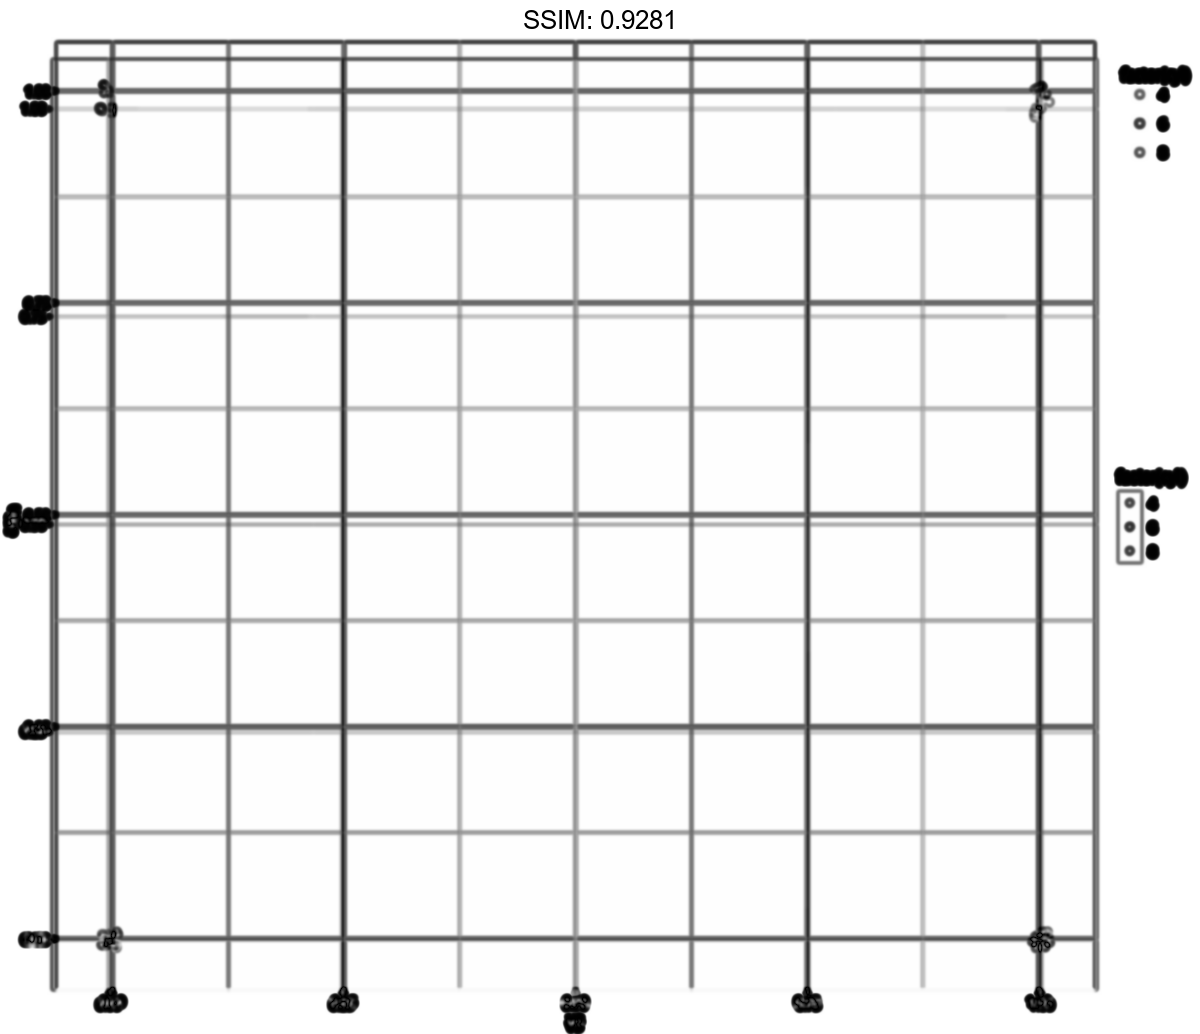
p3 <- ggplot(mtcars, aes(vs, am, colour = factor(cyl))) +
  geom_jitter(alpha = 1/5, width = 0.01, height = 0.01)
p <-  p3 + guides(colour = guide_legend(override.aes = list(alpha = 1)))
plotly::ggplotly(p)


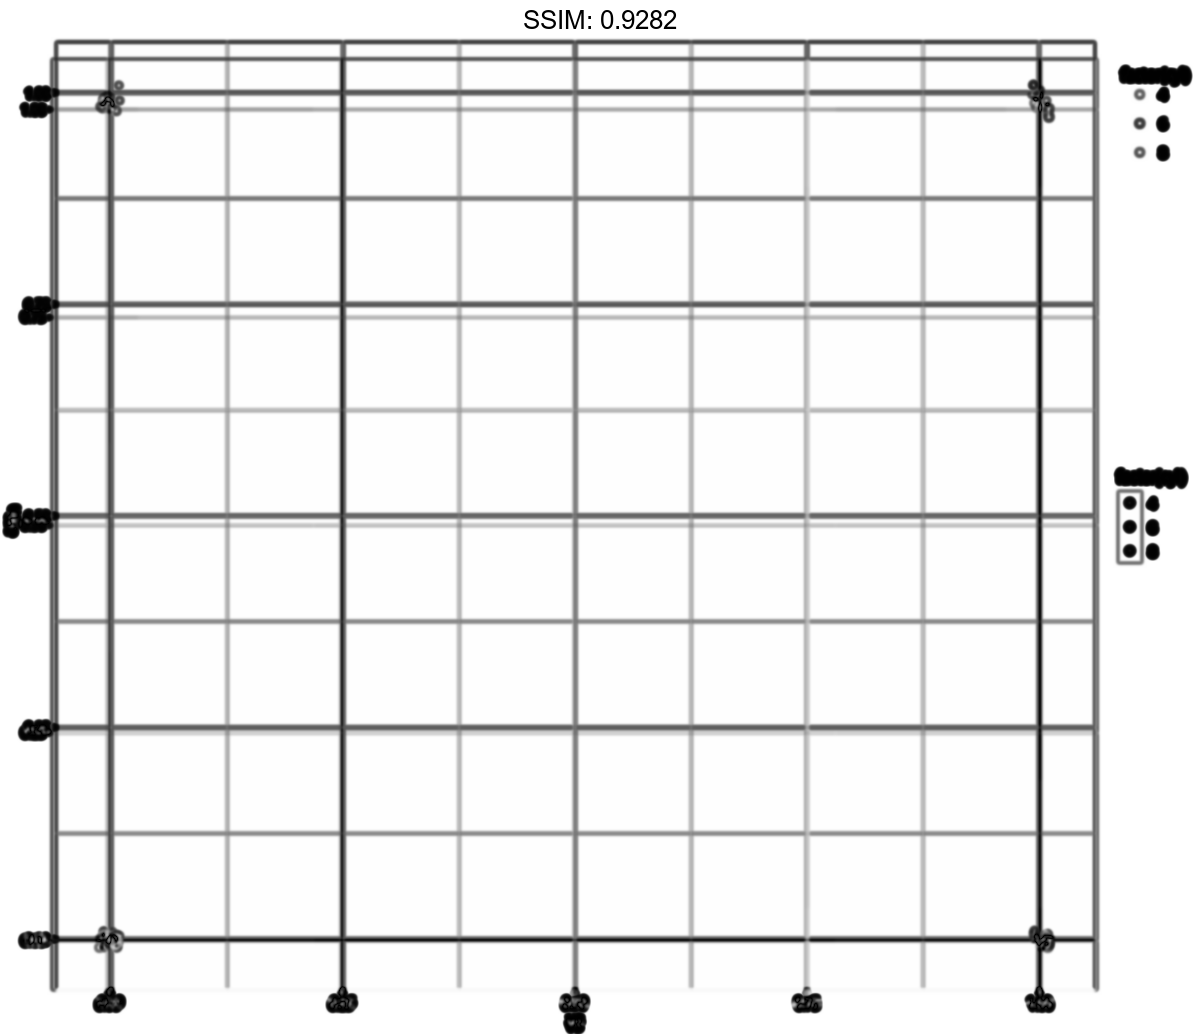
df <- data.frame(x = 1:20, y = 1:20, color = letters[1:20])
p <- ggplot(df, aes(x, y)) +
  geom_point(aes(colour = color))
p <-  p + guides(col = guide_legend(nrow = 8))
plotly::ggplotly(p)


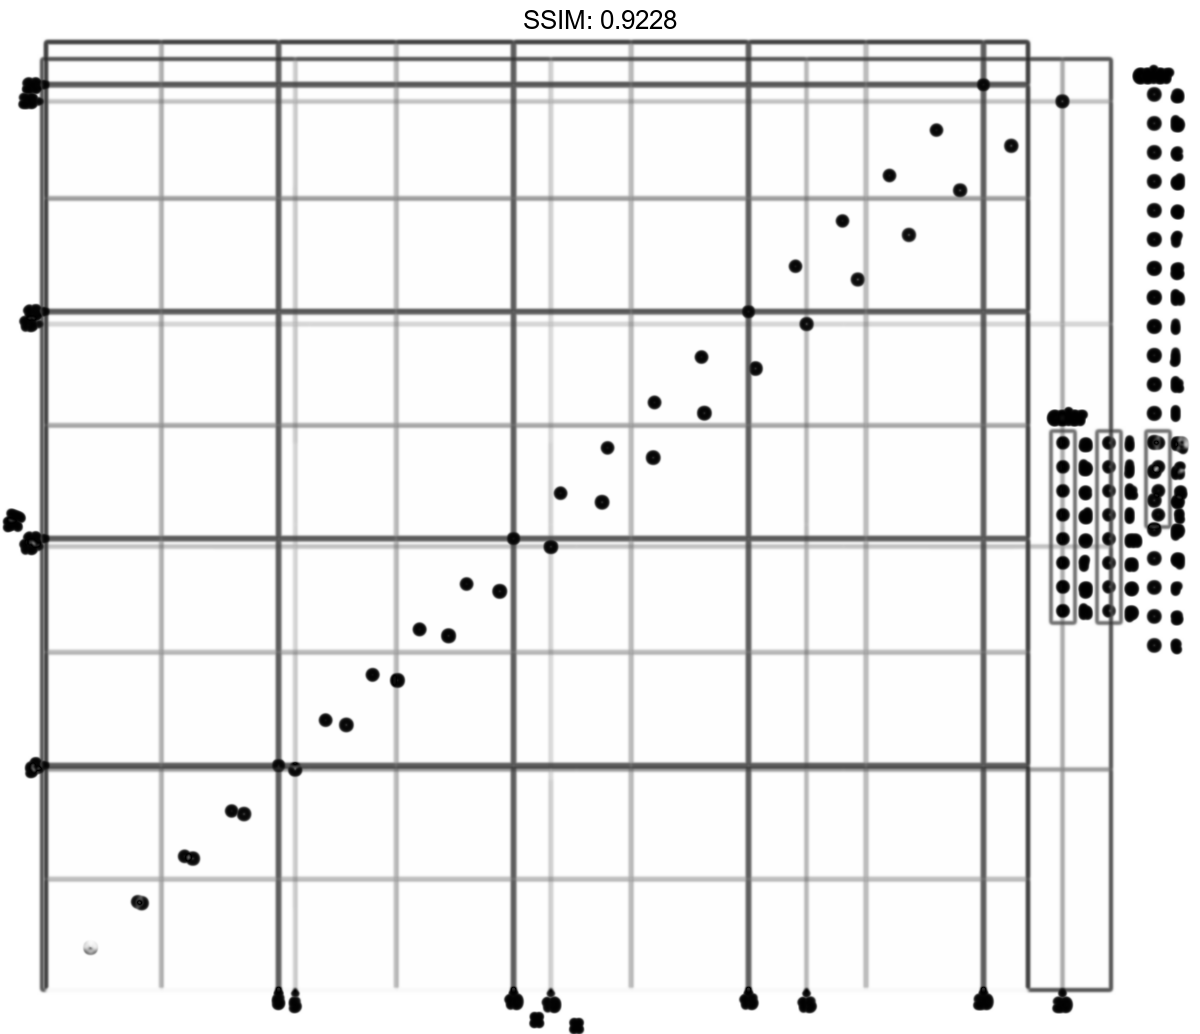
df <- data.frame(x = 1:20, y = 1:20, color = letters[1:20])
p <- ggplot(df, aes(x, y)) +
  geom_point(aes(colour = color))
p <-  p + guides(col = guide_legend(ncol = 8))
plotly::ggplotly(p)


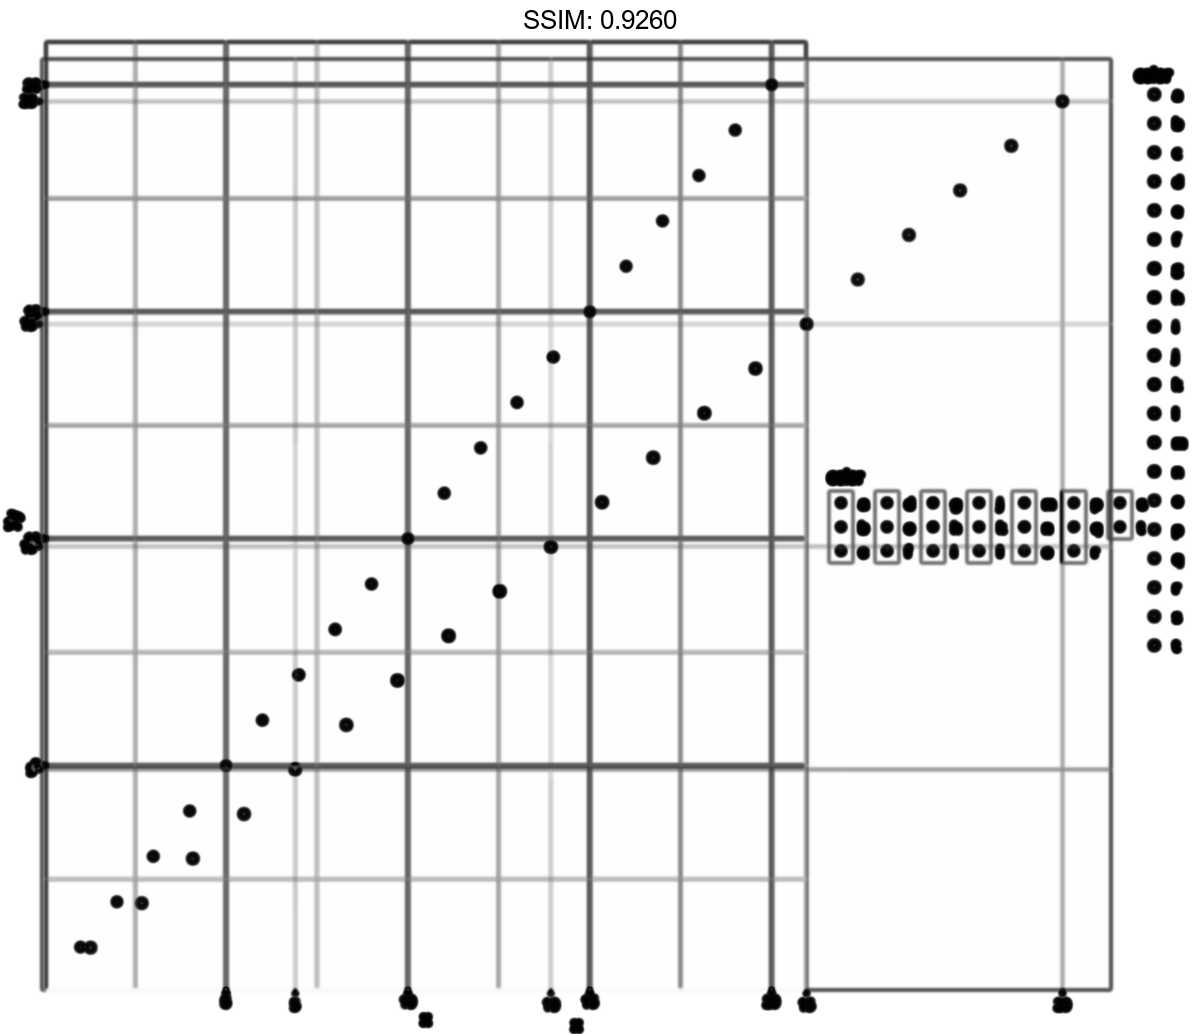
df <- data.frame(x = 1:20, y = 1:20, color = letters[1:20])
p <- ggplot(df, aes(x, y)) +
  geom_point(aes(colour = color))
p <-  p + guides(col = guide_legend(nrow = 8, byrow = TRUE))
plotly::ggplotly(p)


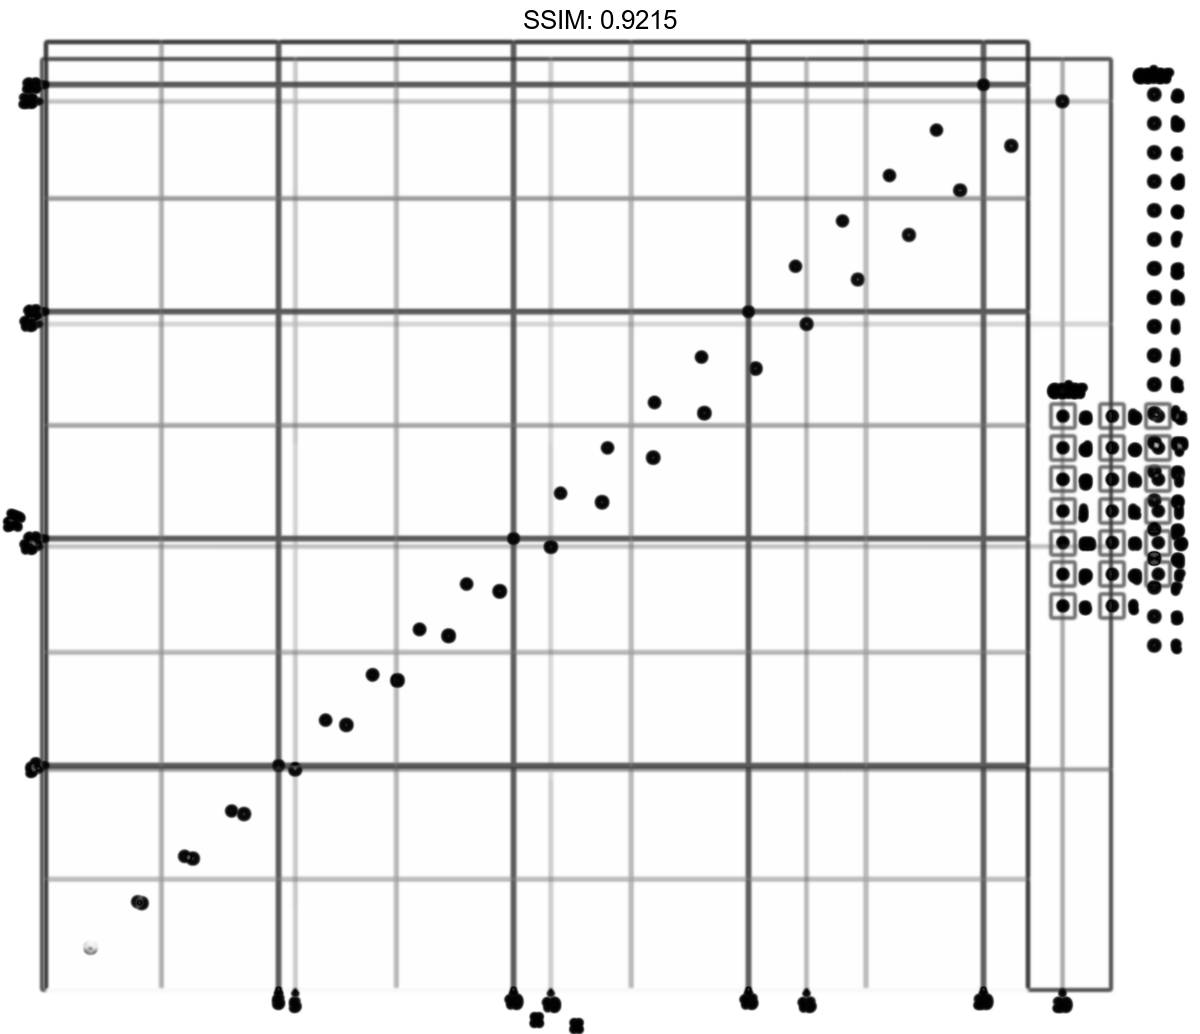
df <- data.frame(x = 1:20, y = 1:20, color = letters[1:20])
p <- ggplot(df, aes(x, y)) +
  geom_point(aes(colour = color))
p <-  p + guides(col = guide_legend(reverse = TRUE))
plotly::ggplotly(p)


